What is Analytics Plus ?
Connect to IT applications, import data from databases and gain insight into all aspects of your IT with Manage Engine Analytics Plus.
What is it for?
Analytics Plus integrates perfectly with many popular IT applications and offers built-in reports and dashboards to help you start analyzing right away. Break down the data, drill down to view details, and customize these reports to create your own KPIs or metrics.
How it works?
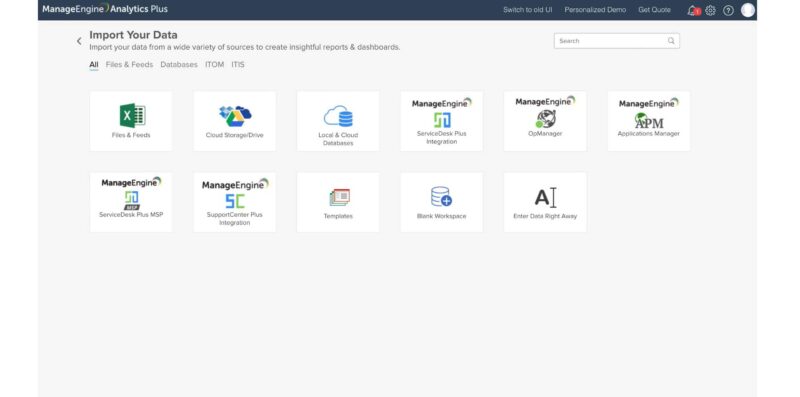
Bring in data stored in cloud or on-premises databases. Import data from web feeds, spreadsheets and flat files such as Microsoft Excel, CSV, HTML, JSON, XML and cloud drives such as Box, Dropbox, Google Drive and OneDrive. Analytics Plus will automatically analyze your data to generate impactful reports in seconds.
Analytics Plus Versions
Standard – Supports collaboration between multiple users, Supports any data source, Add unlimited data rows and workspaces
Professional – Supports collaboration between multiple users, Supports all available data sources, Add unlimited data rows and workspaces, Blend data from multiple data sources
Use Cases
Now you can confidently plan your IT budget and staffing needs and prepare for sudden changes in your business. Analytics Plus’ powerful forecasting algorithm analyzes historical data to make accurate predictions for the future.
Why CanCloud?
CanCloud has team members who have proven their expertise in Active Directory, Office 365, Exchange with numerous projects and carry this expertise forward with Manage Engine products.
Analytics Plus – Example Screenshots
Data is usually stored in different file formats such as CSV, XLS, JSON HTML. Easily import data from these sources and start generating reports. Tabular data embedded in websites can be imported directly for analysis. Import data stored in different cloud databases and local databases for automated analysis. Synchronize your data and schedule import periodically to synchronize the latest data for dynamic reporting.
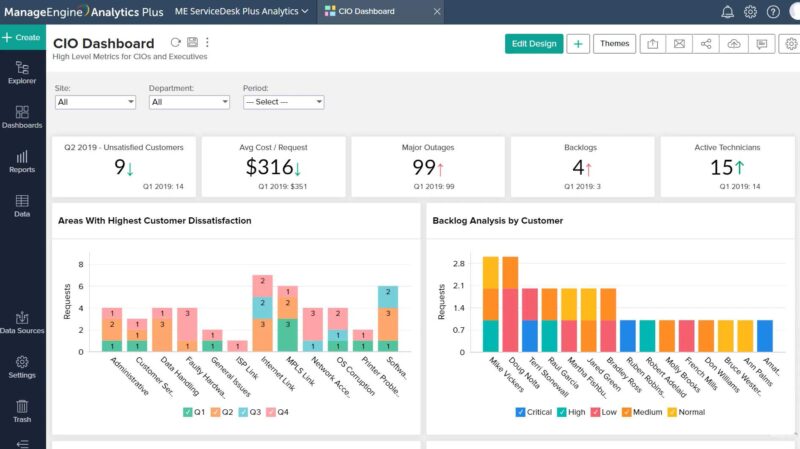
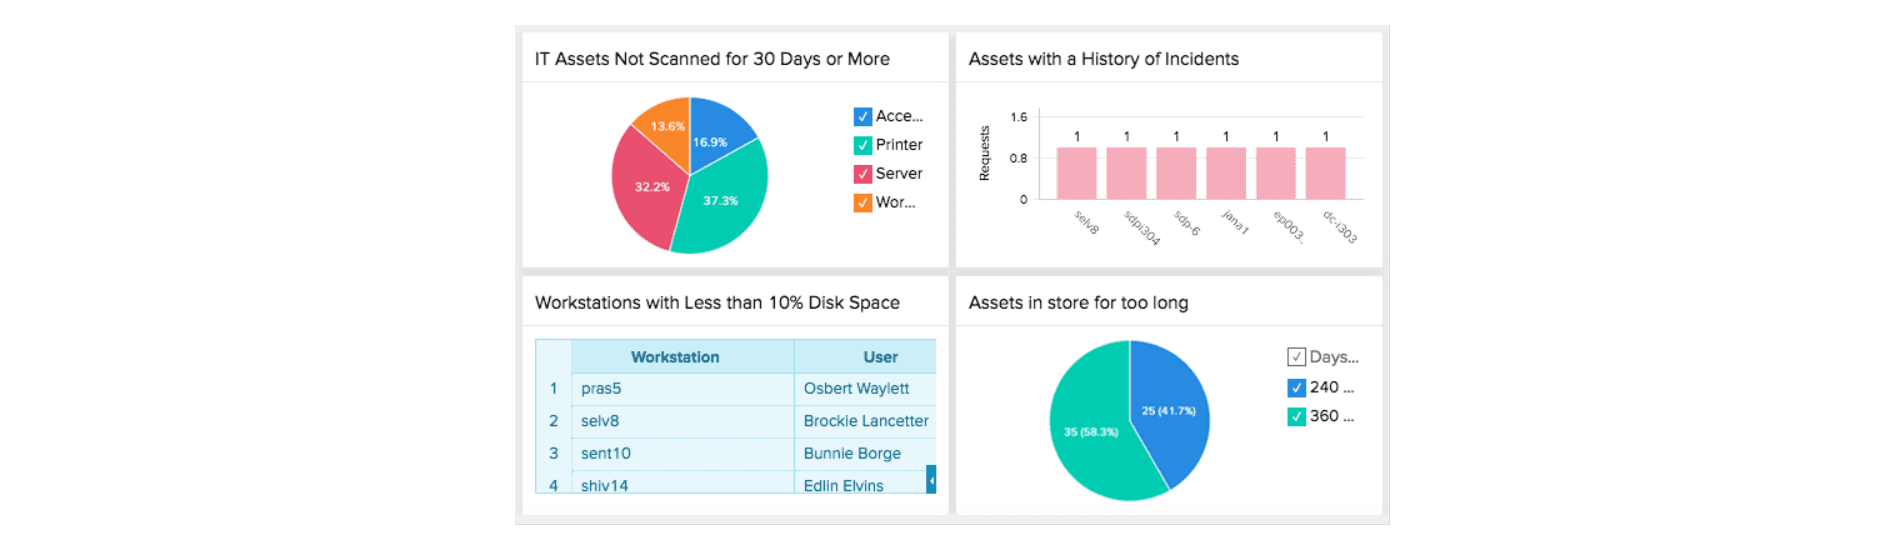
Bring Your Data to Life
Select the required KPIs using a simple drag and drop interface. Create intuitive reports and dashboards exactly the way you want them. No technical expertise required. Break down data, drill down and change the view using different chart types, visualization tools and predefined templates.
Share and Collaborate
You can now set granular permissions for users and groups – give them read-only, write-only or export access. Share data, analyze it as a group and quickly reach a consensus. Send your reports and dashboards by email or export them in CSV, Excel, PDF and HTML formats for wider access.